From Feedback to Impact:
How a Better Rating System Elevated User Experience

This case study is about designing the rating system during the redesign of Okala’s product, which helped improve the overall user experience.
About Okala
Outcome
Since both the biker’s delivery performance and the store’s efficiency in fulfilling orders directly affect customer satisfaction, we redesigned the rating system to be more effective. By tracking performance at scale and gathering real-time user feedback right after delivery, we took a data-driven approach to enhance the user experience and increase customer satisfaction.
• Customer satisfaction improved by ~18%, reflecting a better overall user experience.
• Biker performance in customer interactions and delivery efficiency enhanced by ~29%, leading to more reliable service.
• Store performance improved by ~15%, ensuring greater accuracy in order fulfillment and better packaging quality.
My Role
In July 2023, I worked as a Senior Product Designer to improve Okala’s user experience. I collaborated with the research team to gather data and analyze user behavior while leading and working with the design team to build and redesign the Okala application.
My responsibility in this project was to collaborate with the operations team, ensuring that the identified needs and issues were addressed through well-crafted design solutions. My collaboration was decentralized and rotational, involving different teams such as Operations, Commercial, and others.
Imagine thousands of packages being delivered daily from small and large vendors to Okala users’ doorsteps. In that moment, what truly matters to customers?
On-time delivery, secure packaging, receiving the order in perfect condition, polite and professional couriers—
these factors directly shape the user experience.
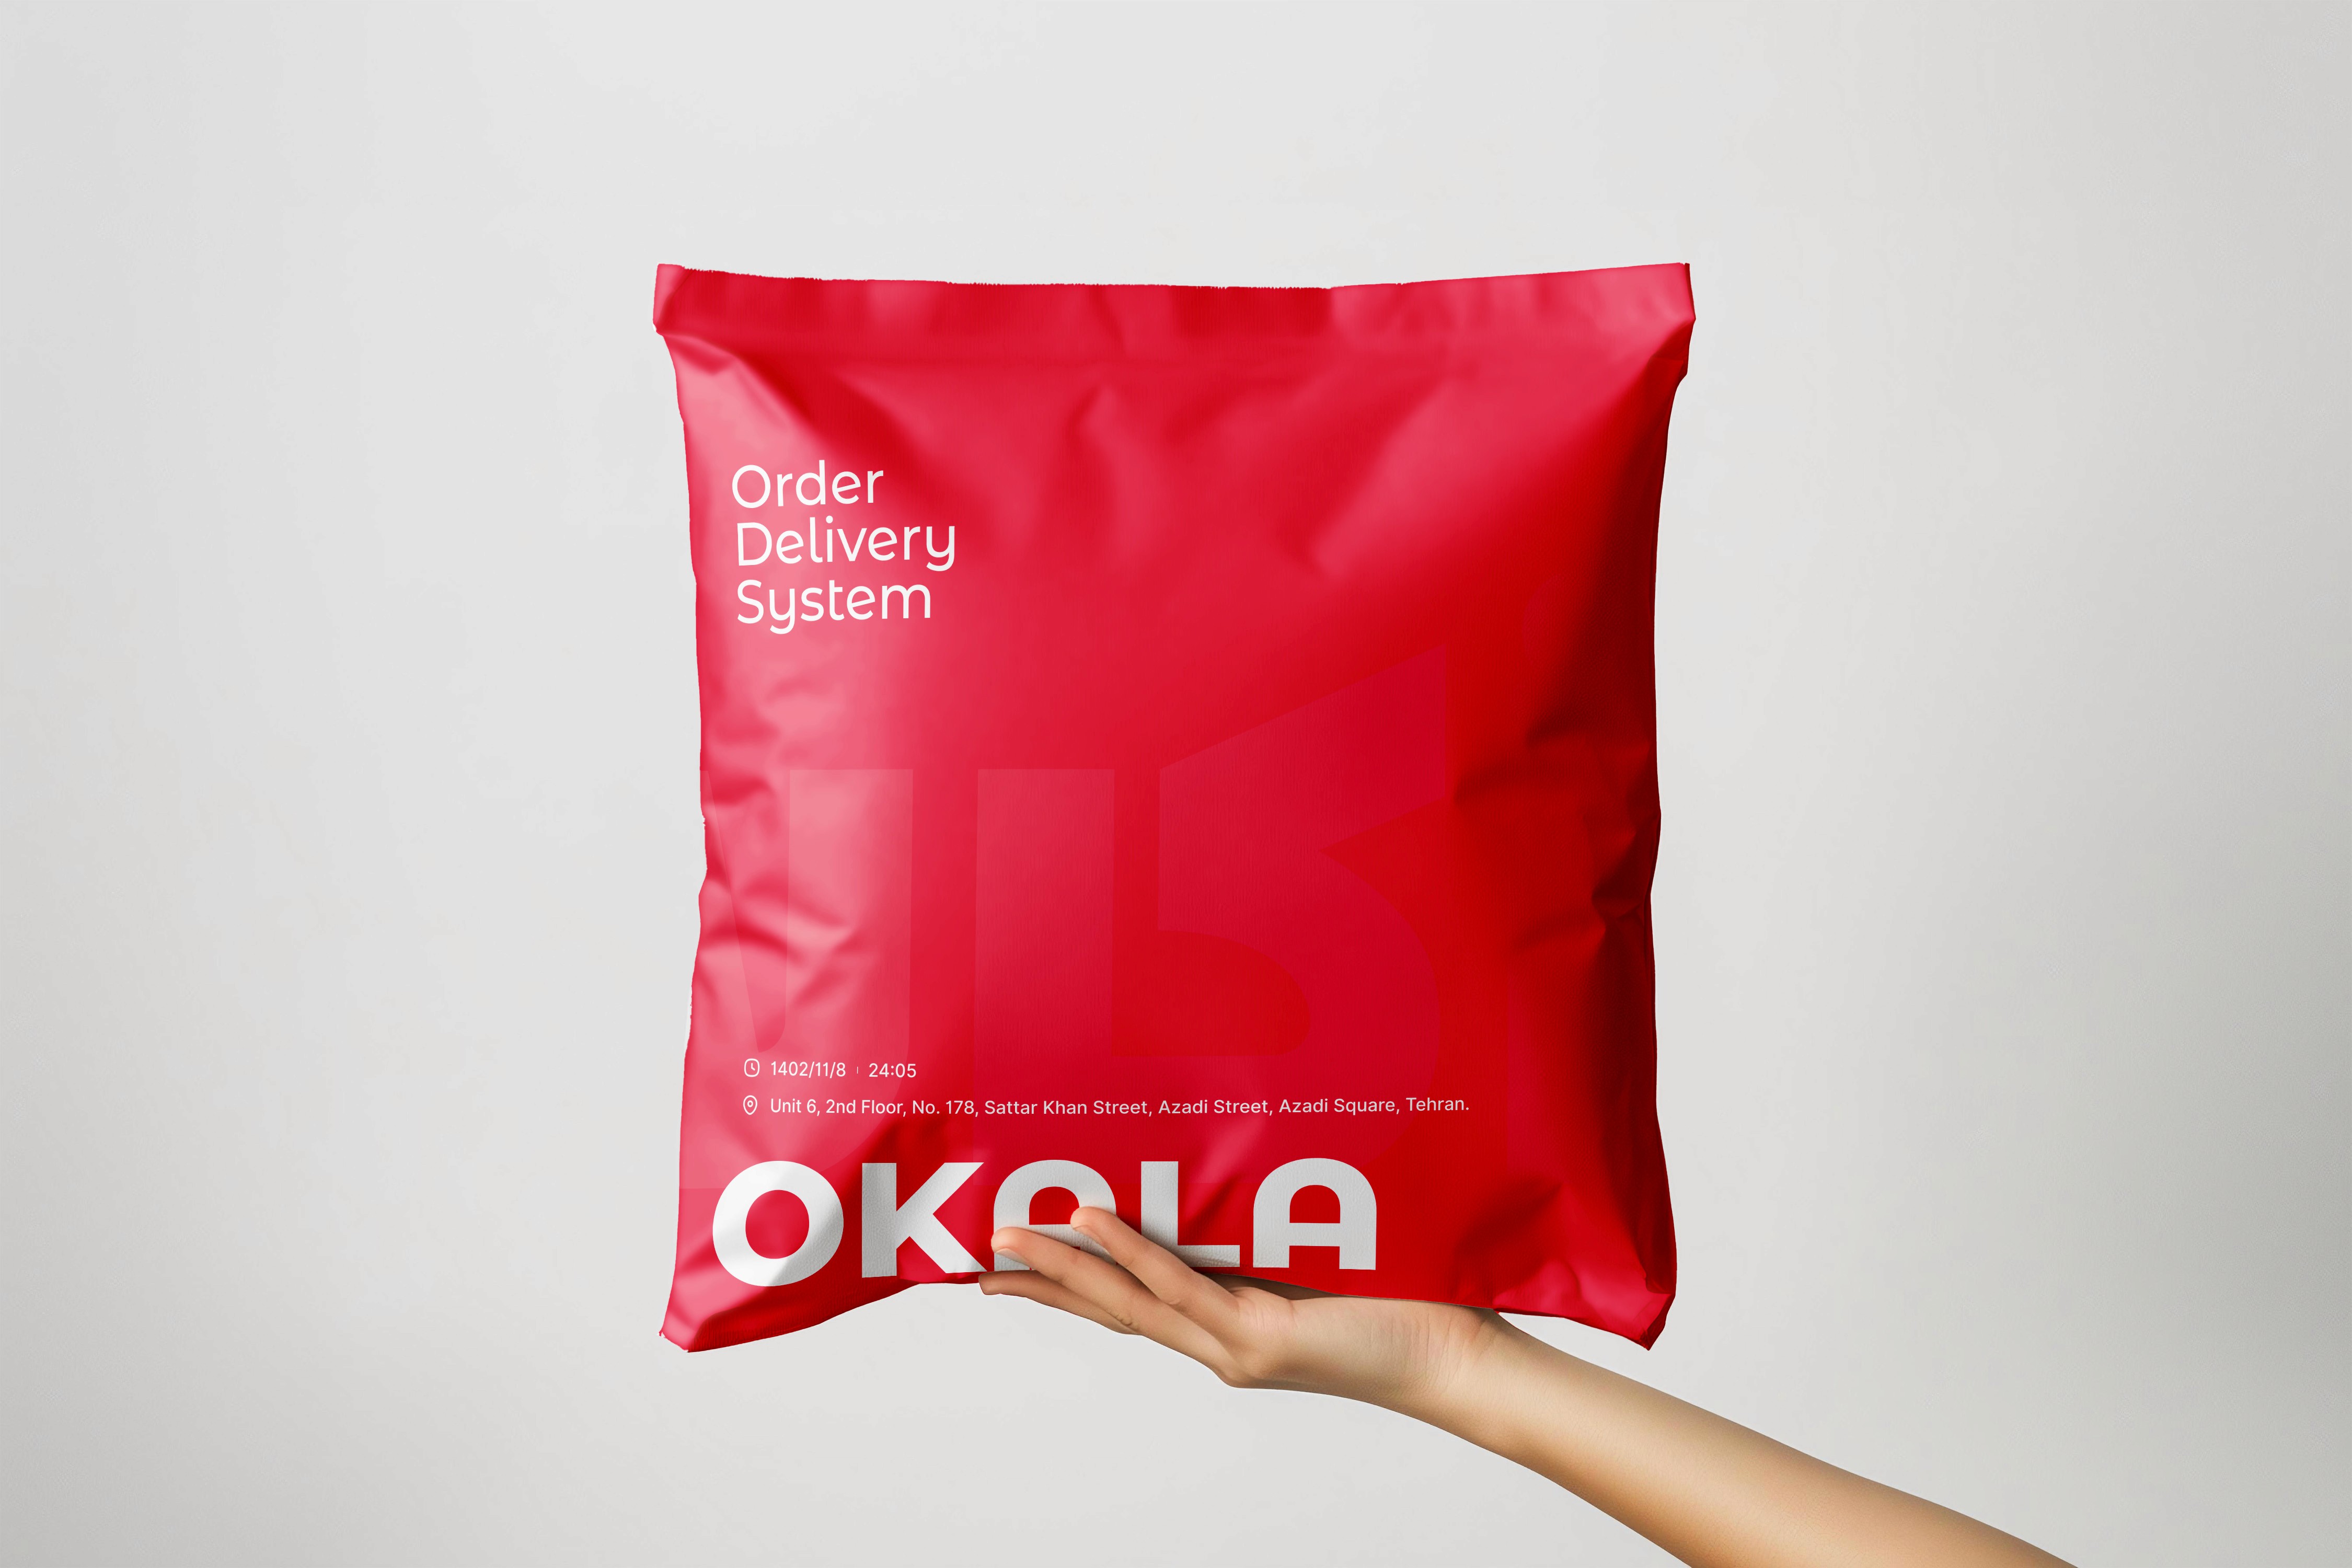
Now, consider how this seemingly simple process plays a crucial role in Okala’s growth. A seamless and well-structured delivery system not only ensures customer satisfaction but also lays the foundation for long-term success.
The real design challenge emerges at the moment of delivery—the exact point where user experience comes to life. Every effort put into redesigning and improving the system leads to this one key moment, which directly impacts repeat purchases and customer loyalty.
By refining this process and analyzing key data points, we can enhance both the courier’s efficiency in delivery and the vendor’s accuracy in order preparation and packaging—ultimately elevating the overall customer experience.
As Okala expanded, it became clear that we needed to enhance our platform to support future growth. A recent product redesign had successfully improved user satisfaction and boosted daily active users. However, delivery-related issues soon emerged as a critical challenge, with users frequently reporting delays, unprofessional courier behavior, and poor packaging—most of which were captured through the call center.
To address this, the operations team planned to introduce a rating system to track delivery quality and measure customer loyalty. However, our challenge extended beyond couriers. Understanding user perceptions of vendors was equally important, adding complexity to our design process.
We needed a solution that not only improved delivery experiences but also provided deeper insights into how users interact with vendors. Balancing rapid growth with evolving user expectations required a data-driven, scalable approach to ensure a seamless shopping experience.
• Collect customer satisfaction feedback for both couriers and vendors.
• Allow users to evaluate the strengths and weaknesses of their orders for both couriers and vendors.
• Ensure the feedback process happens in a single step at the right time and place to minimize user disruption and maintain data quality.
• Enable independent rating for each category (courier and vendor).
• Measure the CSAT (Customer Satisfaction Score) separately for couriers and vendors.
• Analyze the impact on NPS (Net Promoter Score) in coordination with the product team.
To extract suitable parameters for the rating system and identify strengths and weaknesses of both couriers and vendors, we needed to understand the customers’ mental framework and their expectations from both groups.
• Close Surveys: To gather quantitative data and standardize the evaluation criteria.
• In-depth Interviews: To uncover detailed user experiences and gain a deeper understanding of their expectations.
This combination of methods helped us gather the necessary data to define the rating system and set more precise criteria for evaluating the performance of couriers and vendors, which ultimately led to valuable insights and results.
Hypothesis : Prioritization and Identification of Parameters
To understand the user’s mental image of key aspects and how they prioritize them in their minds, based on the methods applied, we reached the following prioritization and identified the strengths and weaknesses for each group, as well as the ideal time and place to display the rate system pop-up.
Method : Close Surveys
We designed a close-ended survey to identify the key factors influencing user satisfaction and dissatisfaction. This quantitative research helps us select the right criteria based on user needs and plan accordingly to rate and evaluate the performance of vendors and couriers.
Number sent: 2000
Number of participants: 371
Method : In-depth Interviews
We conducted scenario-based interviews with customers who had recently made a purchase to understand the factors influencing their satisfaction or dissatisfaction. This qualitative research helped us uncover user expectations and key evaluation criteria.
Invited to the interview via SMS: 20 People
Took part in the phone interview: 13 participants
Interview Duration: 10 min
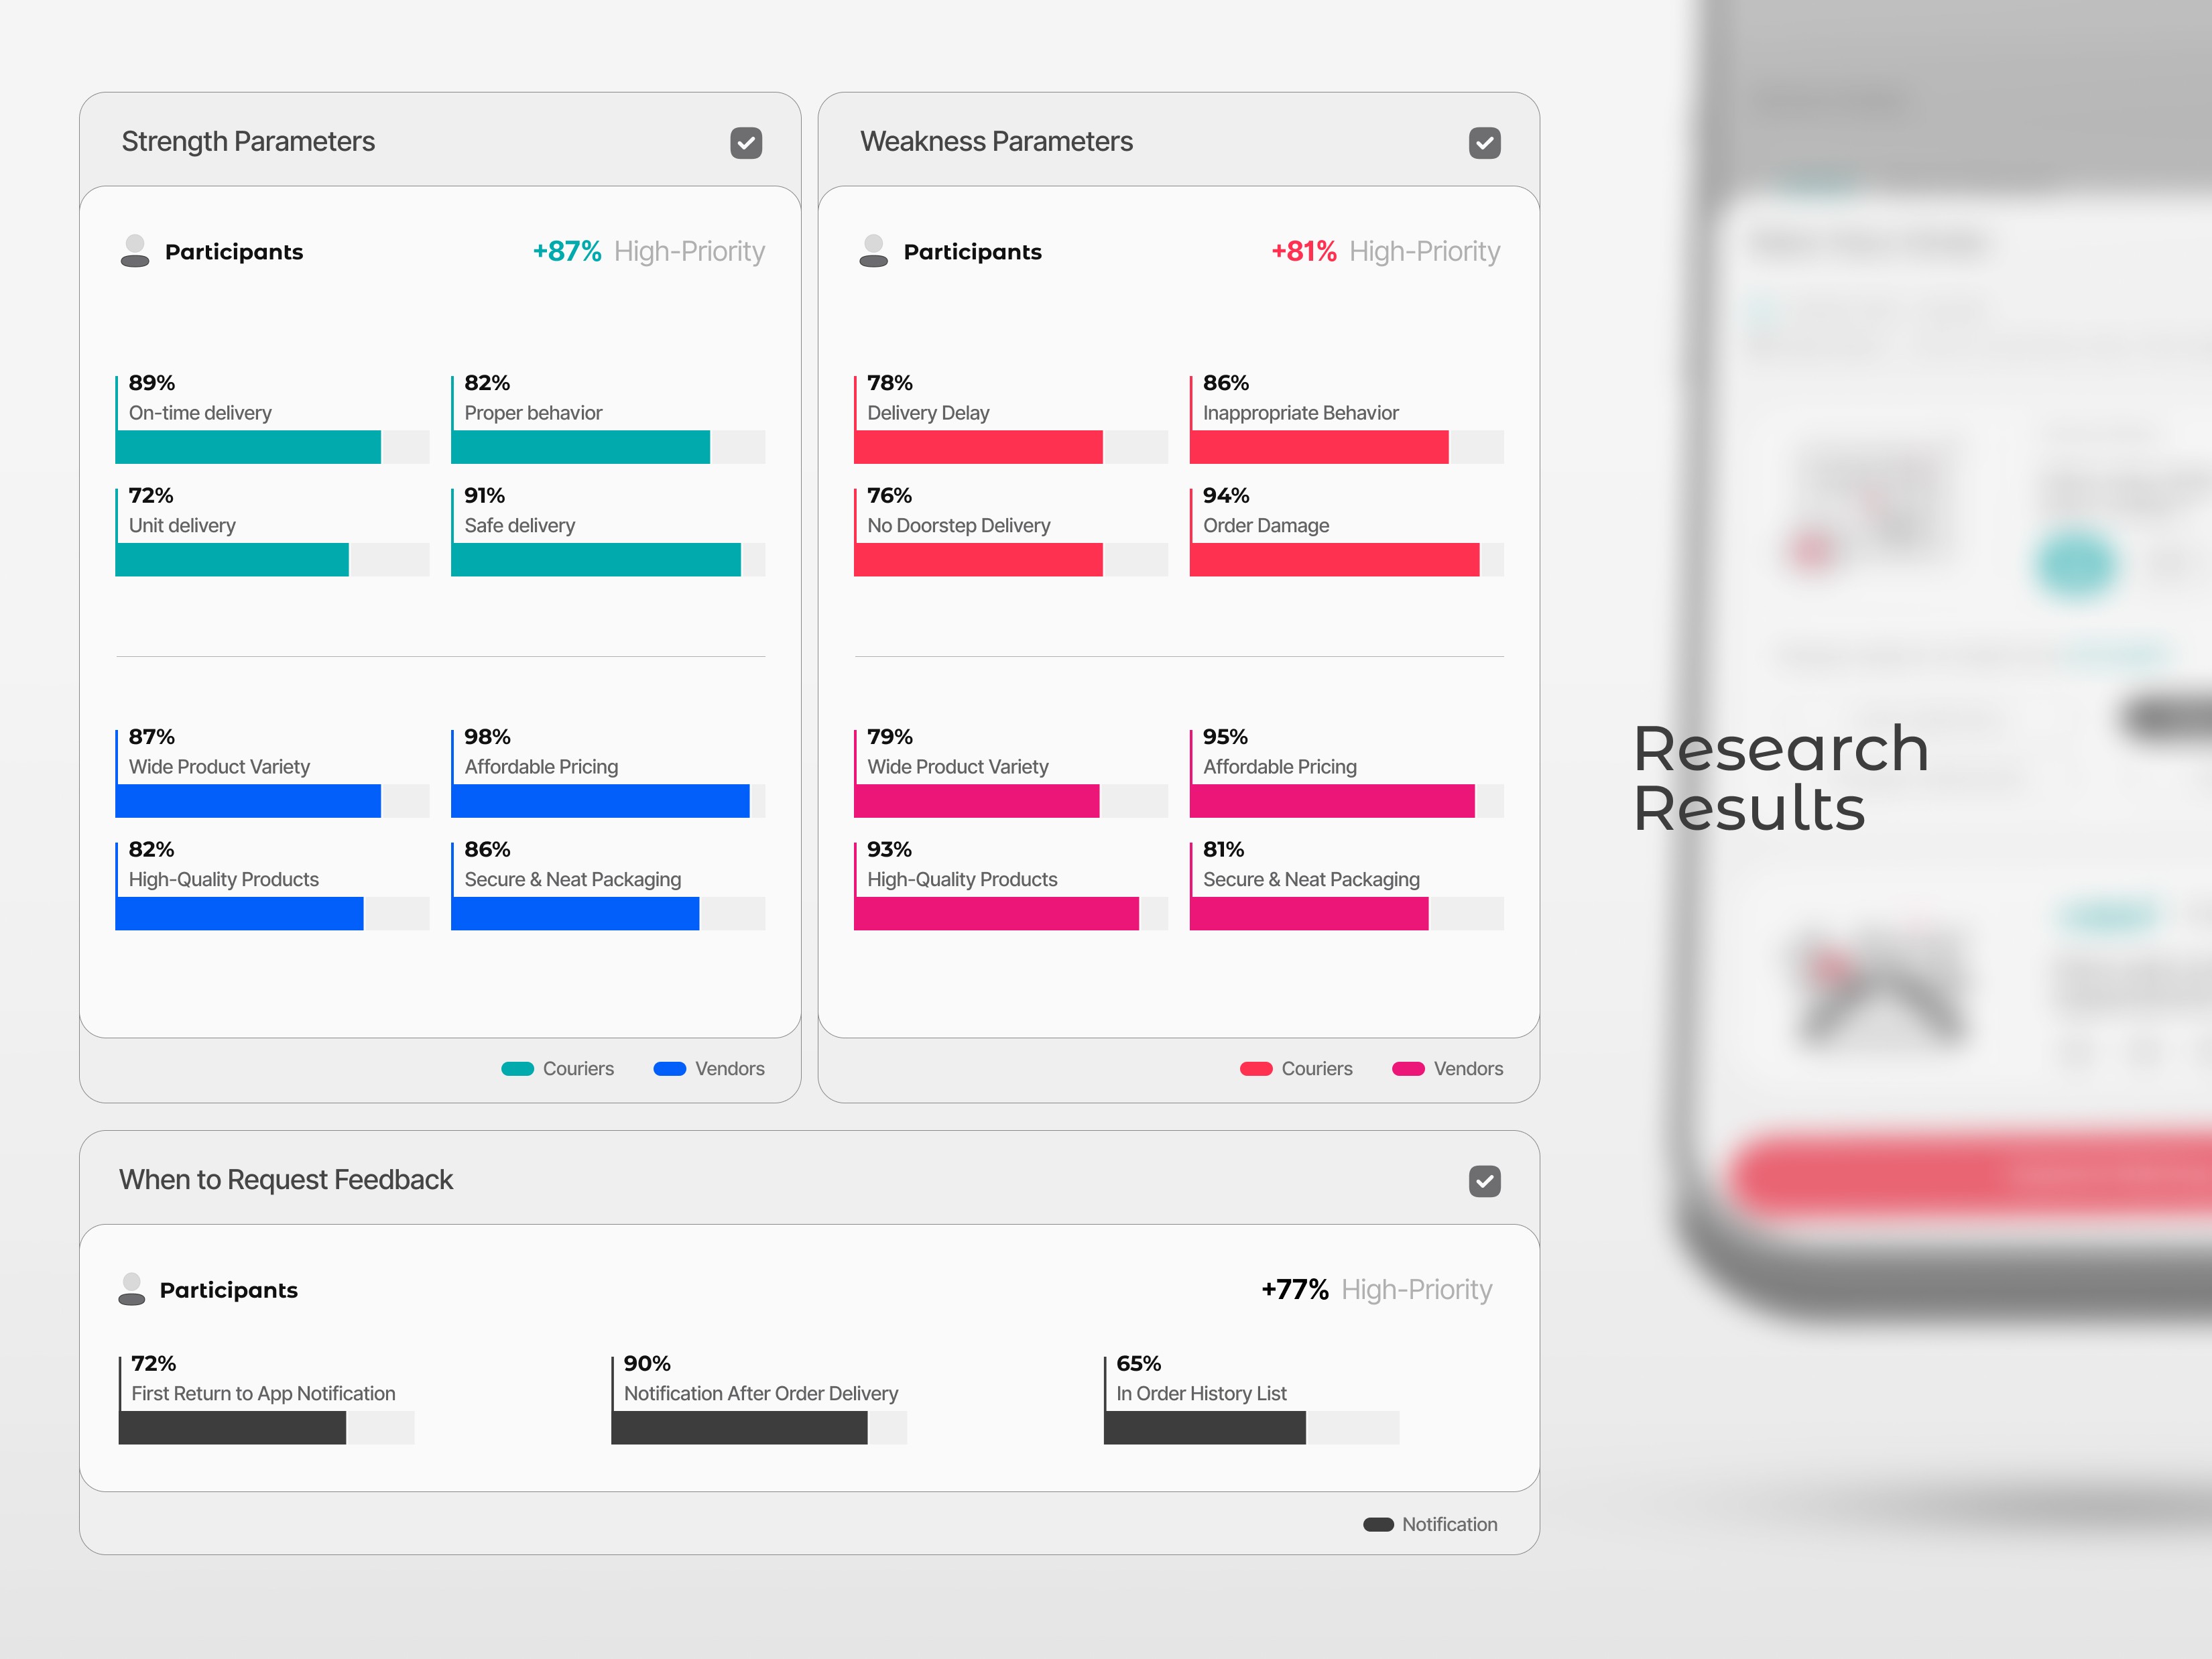
Research Results
• Understanding User Mental Models
Identifying key strengths and weaknesses users expect for couriers and vendors.
• Data-Driven Insights
Determining the best time and place to display the rating system pop-up based on user feedback.
• User-Centered Rating Experience
Gathering insights on the ideal format for displaying ratings and how users prefer to submit their votes.
To find a better solution, I decided to analyze competitor strategies both inside and outside of Iran. This gave me a broader perspective on the problem and helped me design a more effective user experience.
The analysis showed that most competitors collect user feedback separately for vendors and delivery drivers. While this approach could work, I was looking for a more practical solution—one that would simplify the process for users, take less time, and minimize distractions from their main journey.
From this benchmark study, I gathered key insights that shaped the final solution.
Benchmark Results
• Data Collection for Rating Models
Analyzed different rating flow models and competitor strategies.
• Separate Ratings for Vendors & Couriers
Two distinct methods—star ratings and like/dislike options.
• Alternative Flows
Explored different approaches for users who skip the initial rating step.
• Rating History Visibility
Displayed past ratings for each vendor and courier.
• Timing & Validity of Ratings
Determined the optimal time and place to request a rating, with most ratings being valid for up to 24 h after delivery.
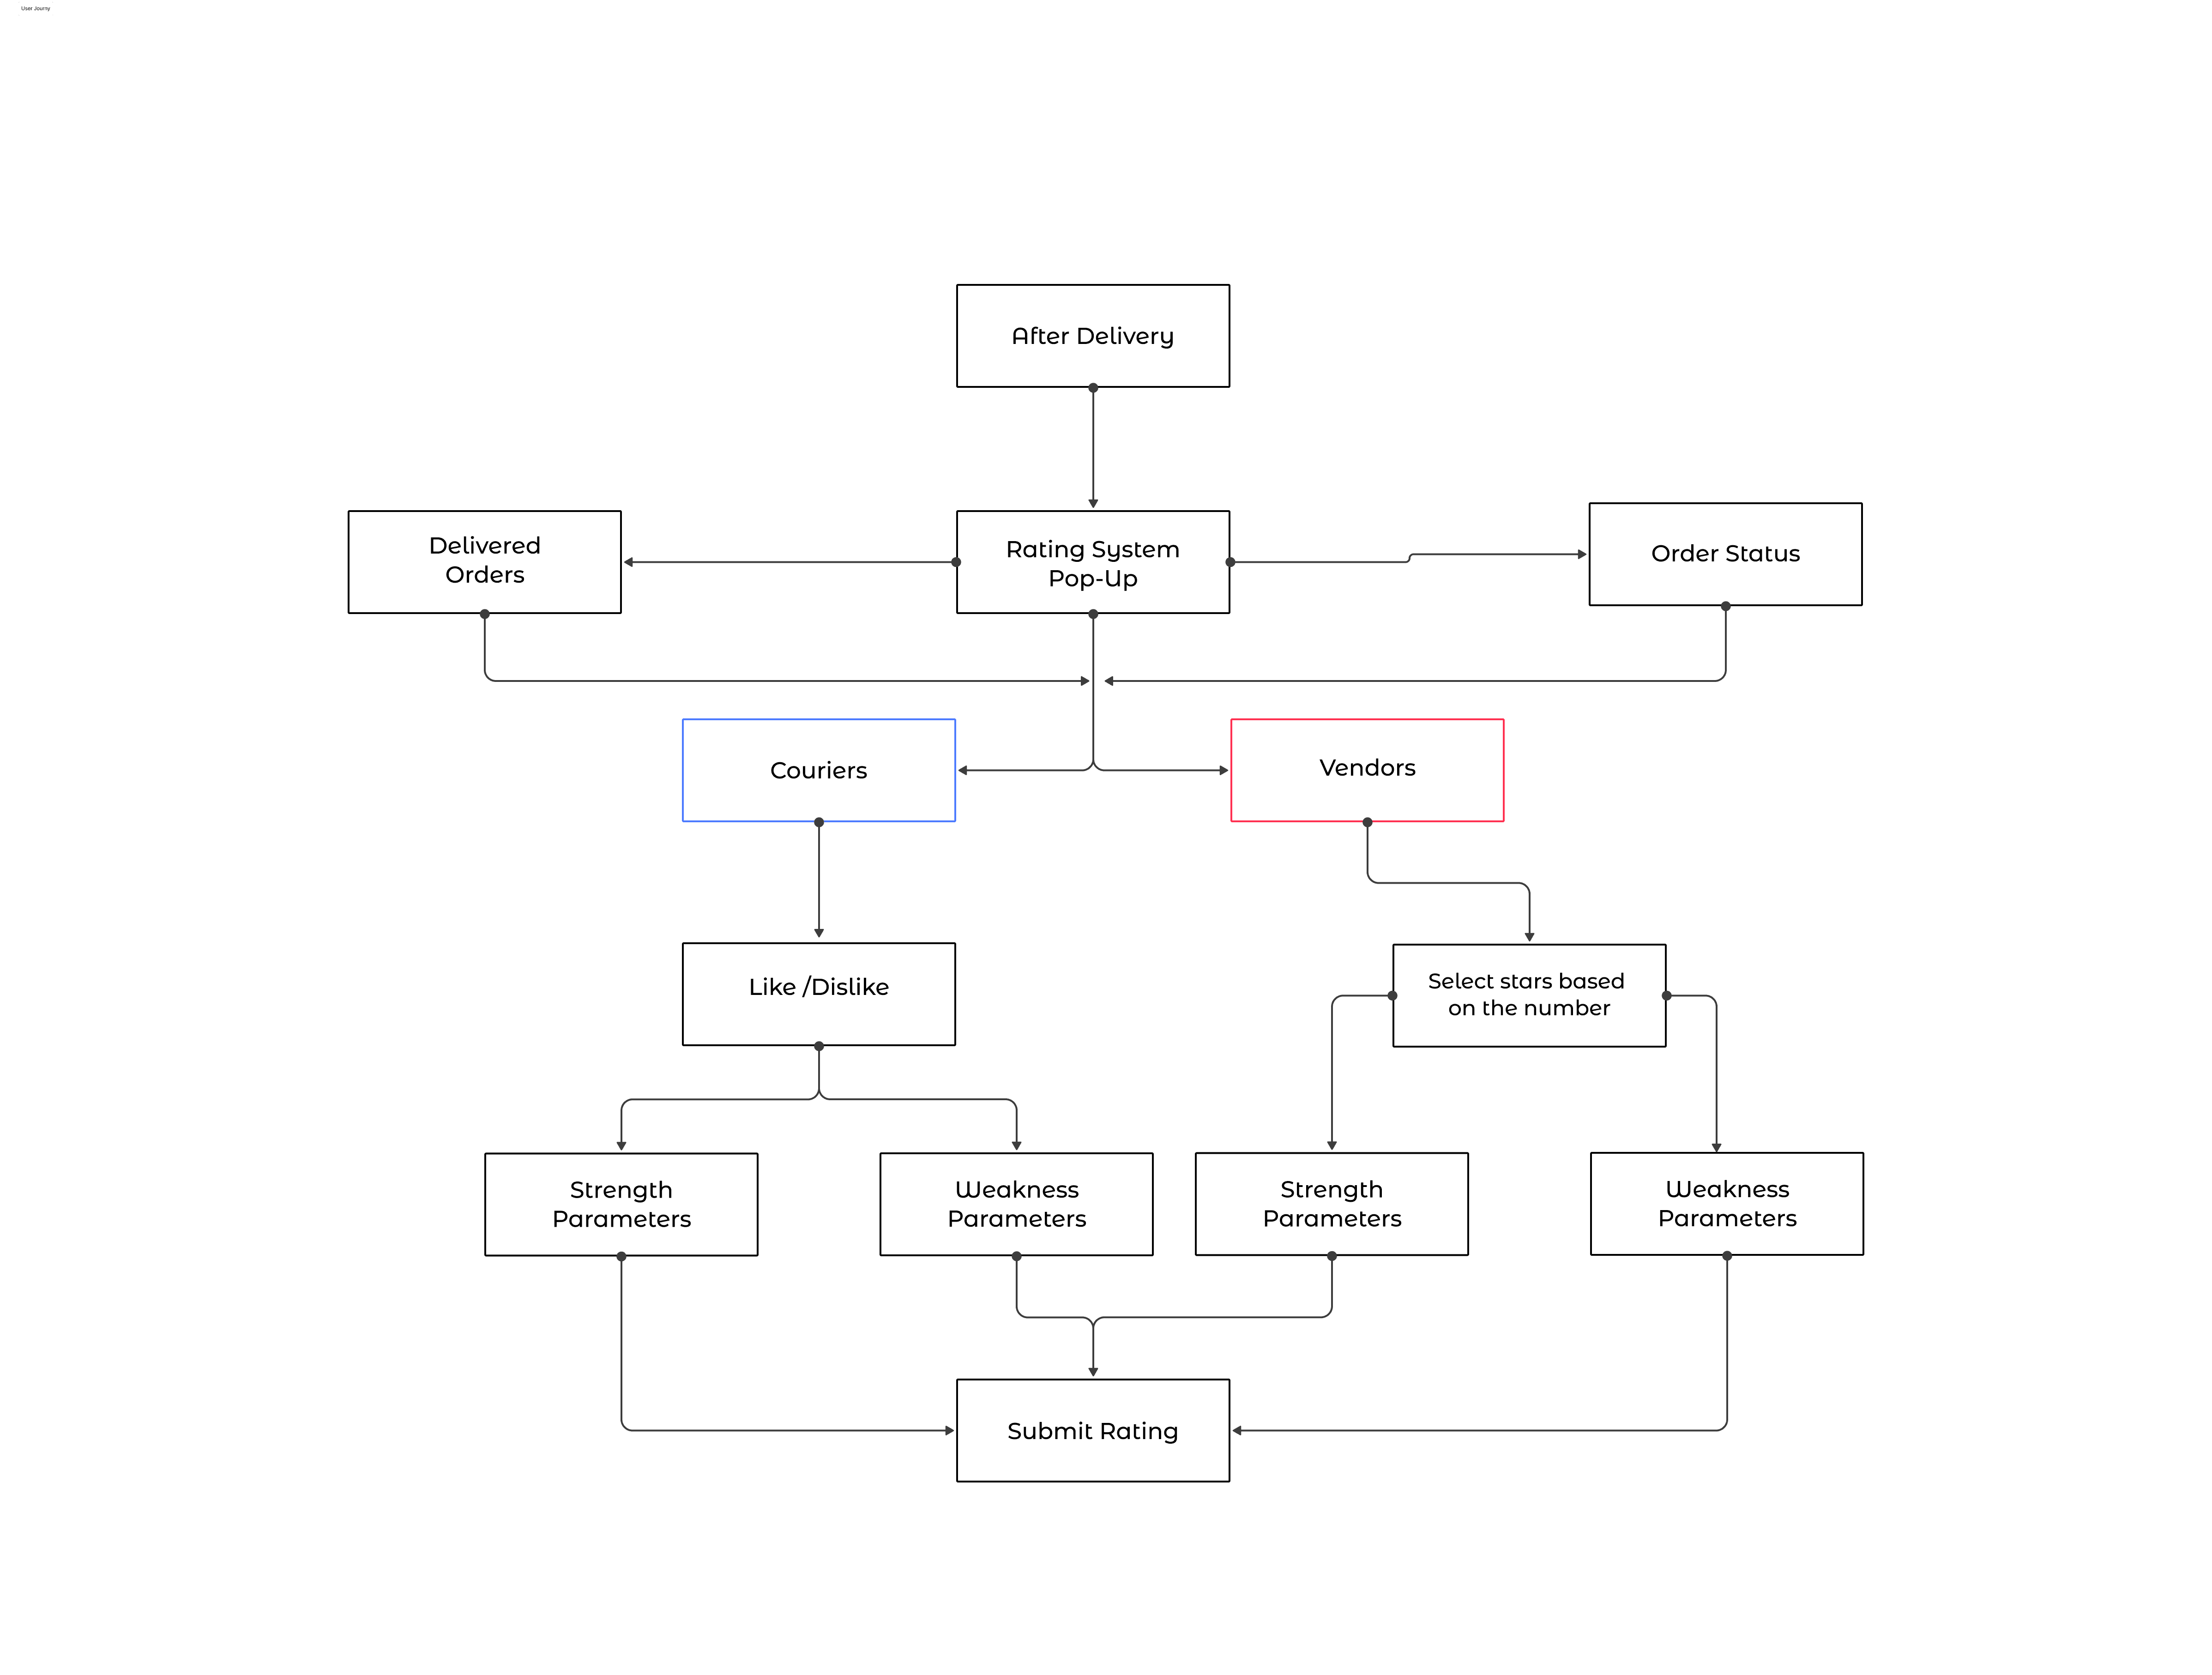
I designed an initial user journey to get an overview of how users navigate the process, helping me identify and design the most suitable solution. This approach ensures better accessibility, optimizes the timing and placement of key interactions, and considers the rating flow for both groups. Additionally, it helps define policies like minimum selection requirements and other essential factors.
To create an effective rating system, we analyzed data from research and benchmarking, categorized our findings, and proposed two design approaches. After wireframing and discussions with stakeholders, we decided to test both concepts through usability studies to evaluate key metrics such as task completion, time on task, drop-off rates, and user behavior before finalizing the solution.
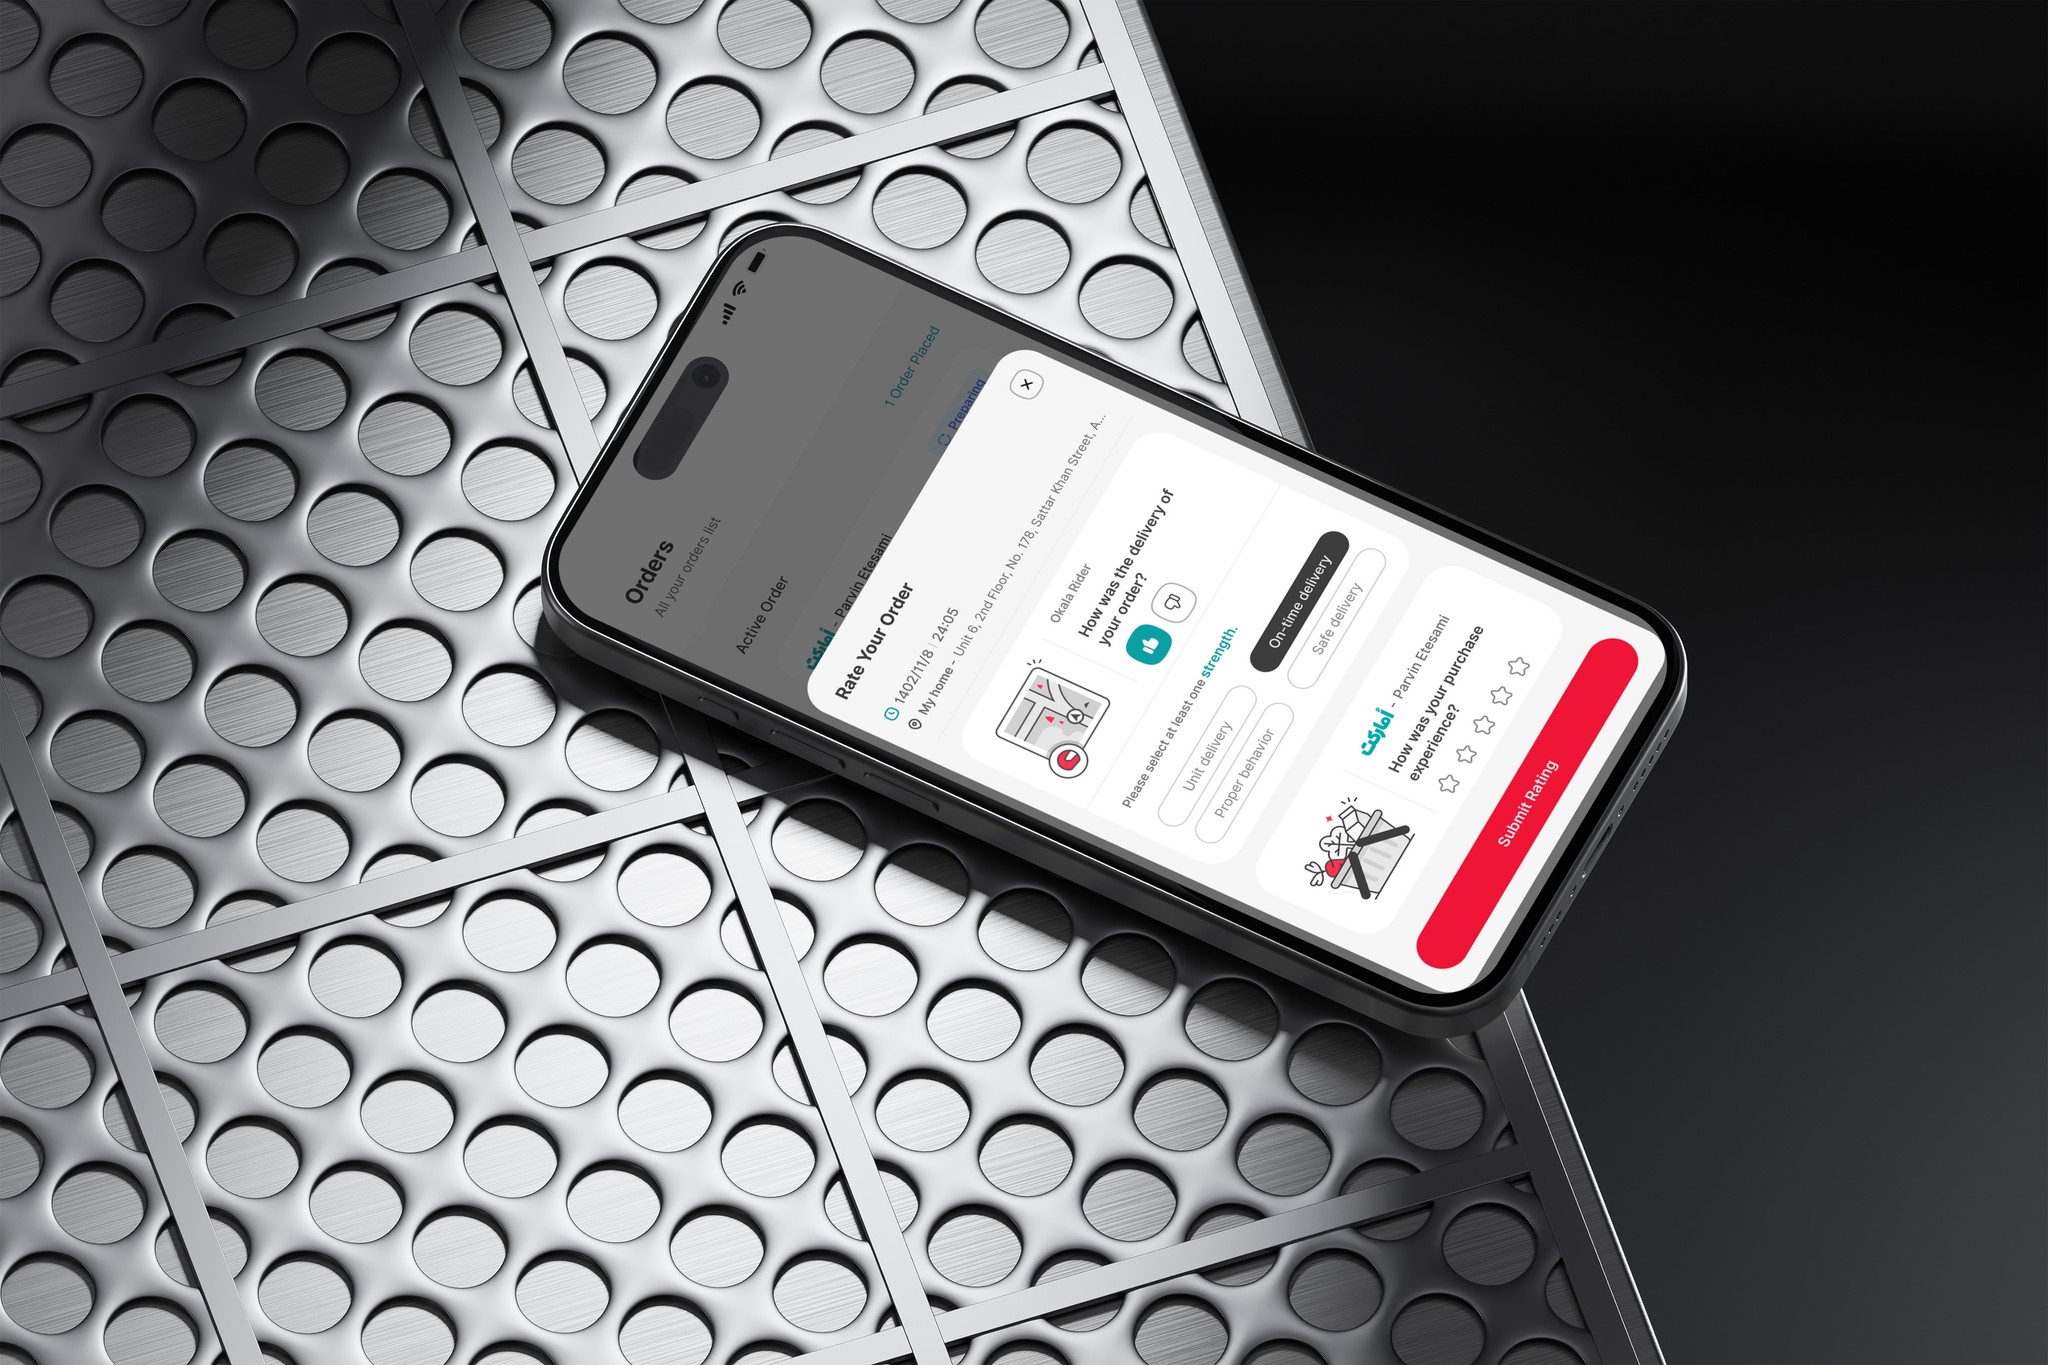
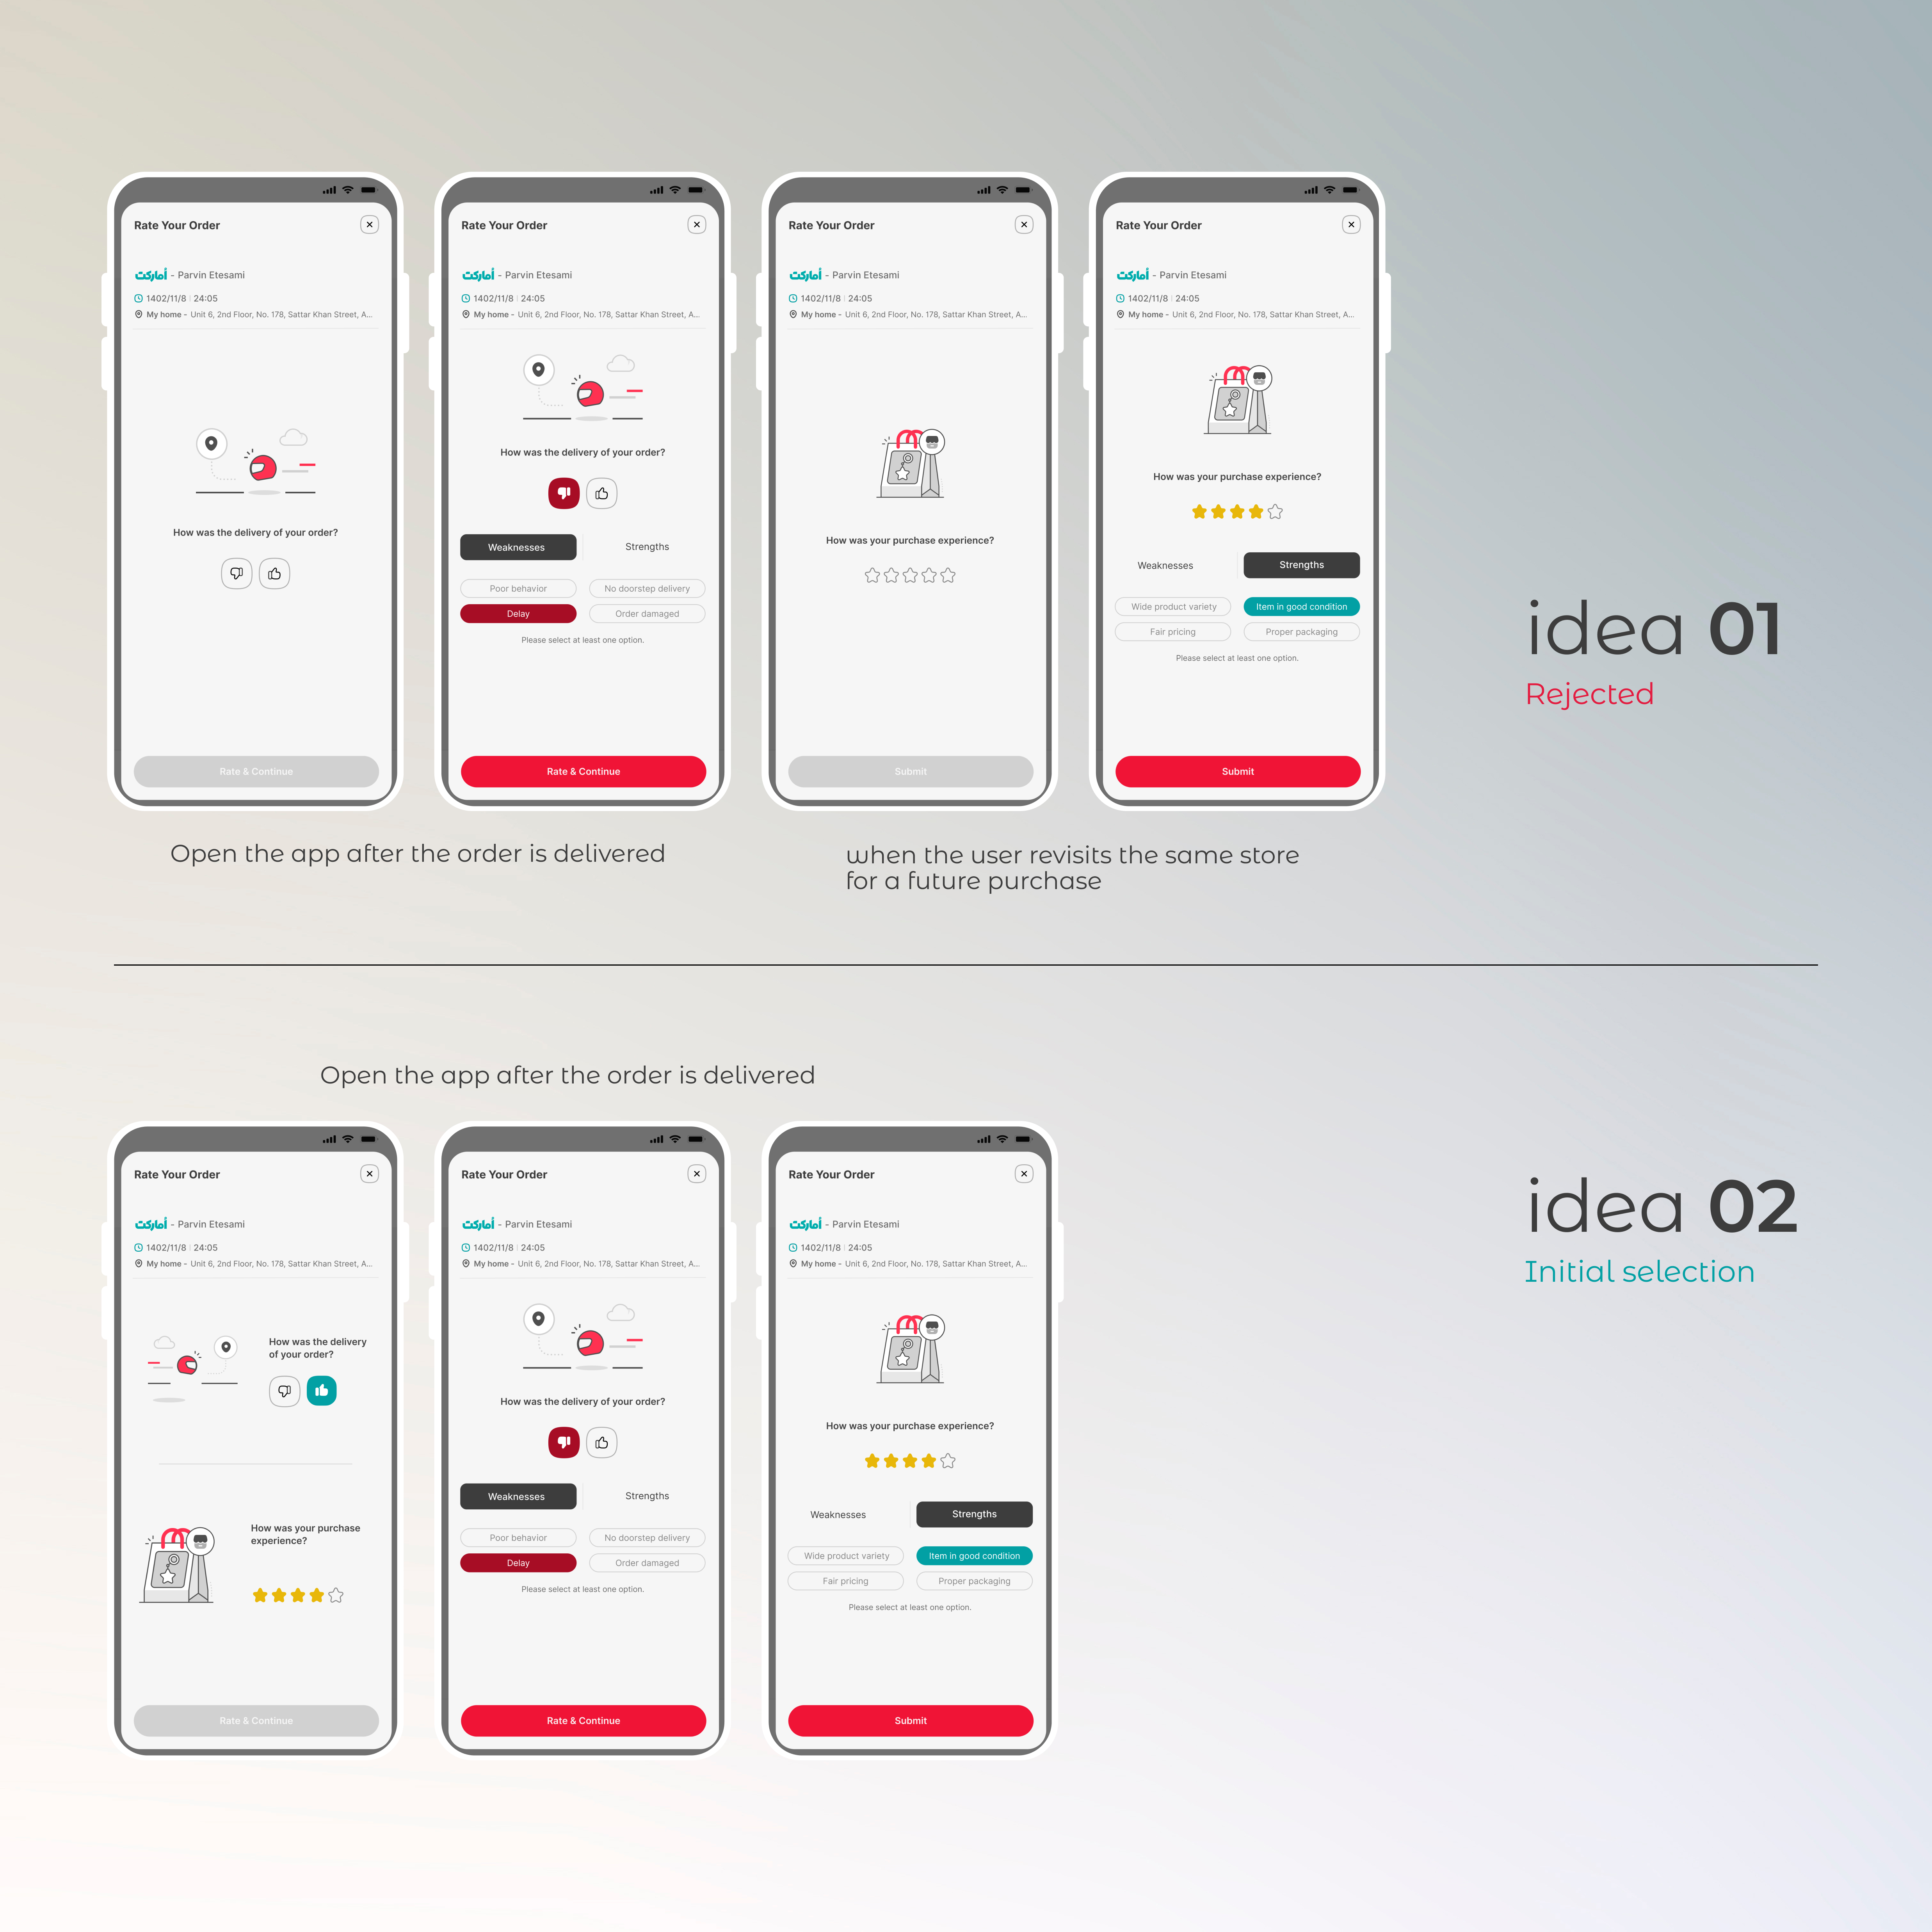
Idea 1: Contextual, Two-Step Rating Approach
• The rating pop-up appears when the user reopens the app after order delivery.
• The courier rating is prioritized, appearing as the first step.
• The second step gathers courier feedback using a like/dislike system, requiring users to select at least one reason.
• Store rating is requested only when the user revisits the same store for a future purchase, displaying past order details to encourage feedback.
Idea 2: Integrated, Single-Flow Rating Approach
• Upon reopening the app, the rating pop-up appears immediately.
• The first screen allows users to rate both the courier and the store simultaneously.
• The next screens collect additional feedback separately for the courier and store, based on the given ratings.
• Users complete the process by submitting all ratings in one step.
Users were triggered to provide ratings through different touchpoints—whether they returned to the app for a new purchase or accessed the rating link via SMS or push notification. The rating remained valid for up to 48 hours after delivery.
Usability testing revealed that the second approach performed better across key metrics, leading to higher engagement and faster task completion. However, user feedback highlighted areas for improvement, requiring further iterations to refine the flow and address concerns.
After the initial test and identifying the better idea based on predefined metrics, we gained insights that required an iteration in the design. We made several updates to refine the experience before finalizing the design. These updates were driven by user feedback, observed behaviors, and the goal of improving key metrics.
Key Updates
• Improved TOT & Flow Efficiency: Optimized the rating process to reduce completion time and minimize drop-offs.
• Flexible Rating Options: Allowed users to rate both couriers and stores or choose to rate only one.
• Refined Information Architecture: Structured all essential data for both couriers and stores, ensuring accessibility based on priorities.
• Effortless Data Collection: Designed an experience that gathers the minimum necessary data with minimal effort from users.
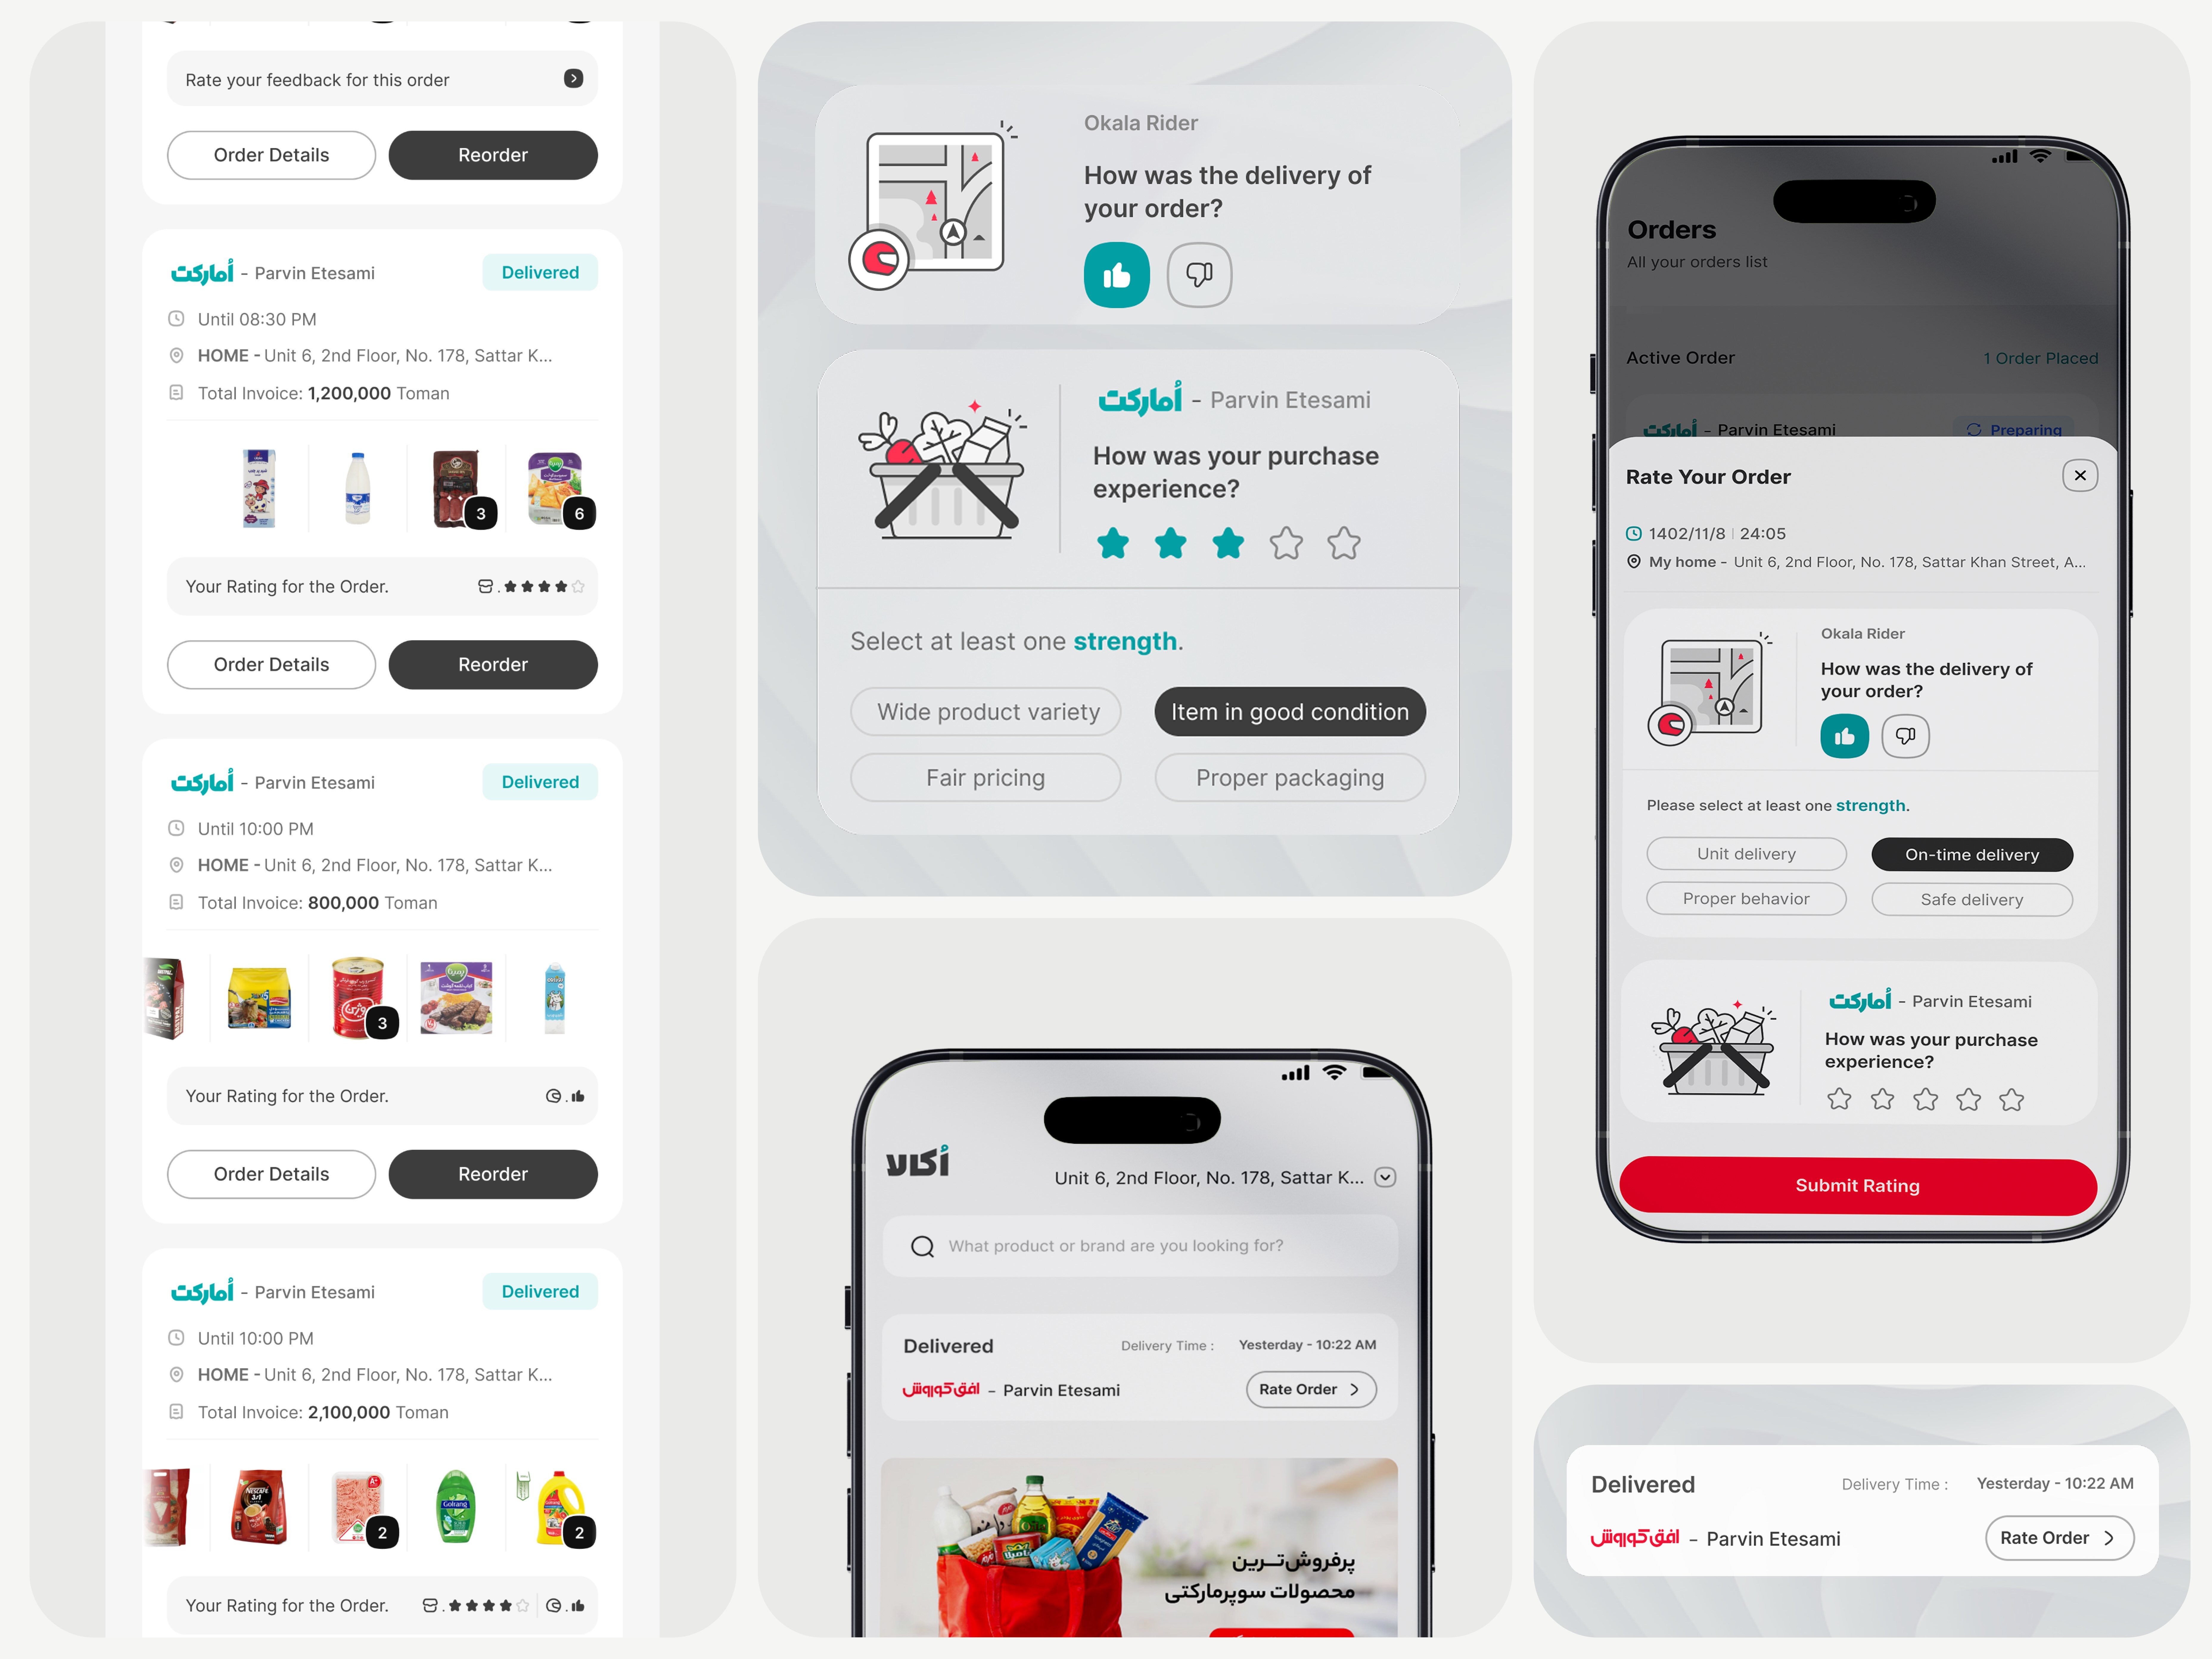
Solutions and Finalizing the Design
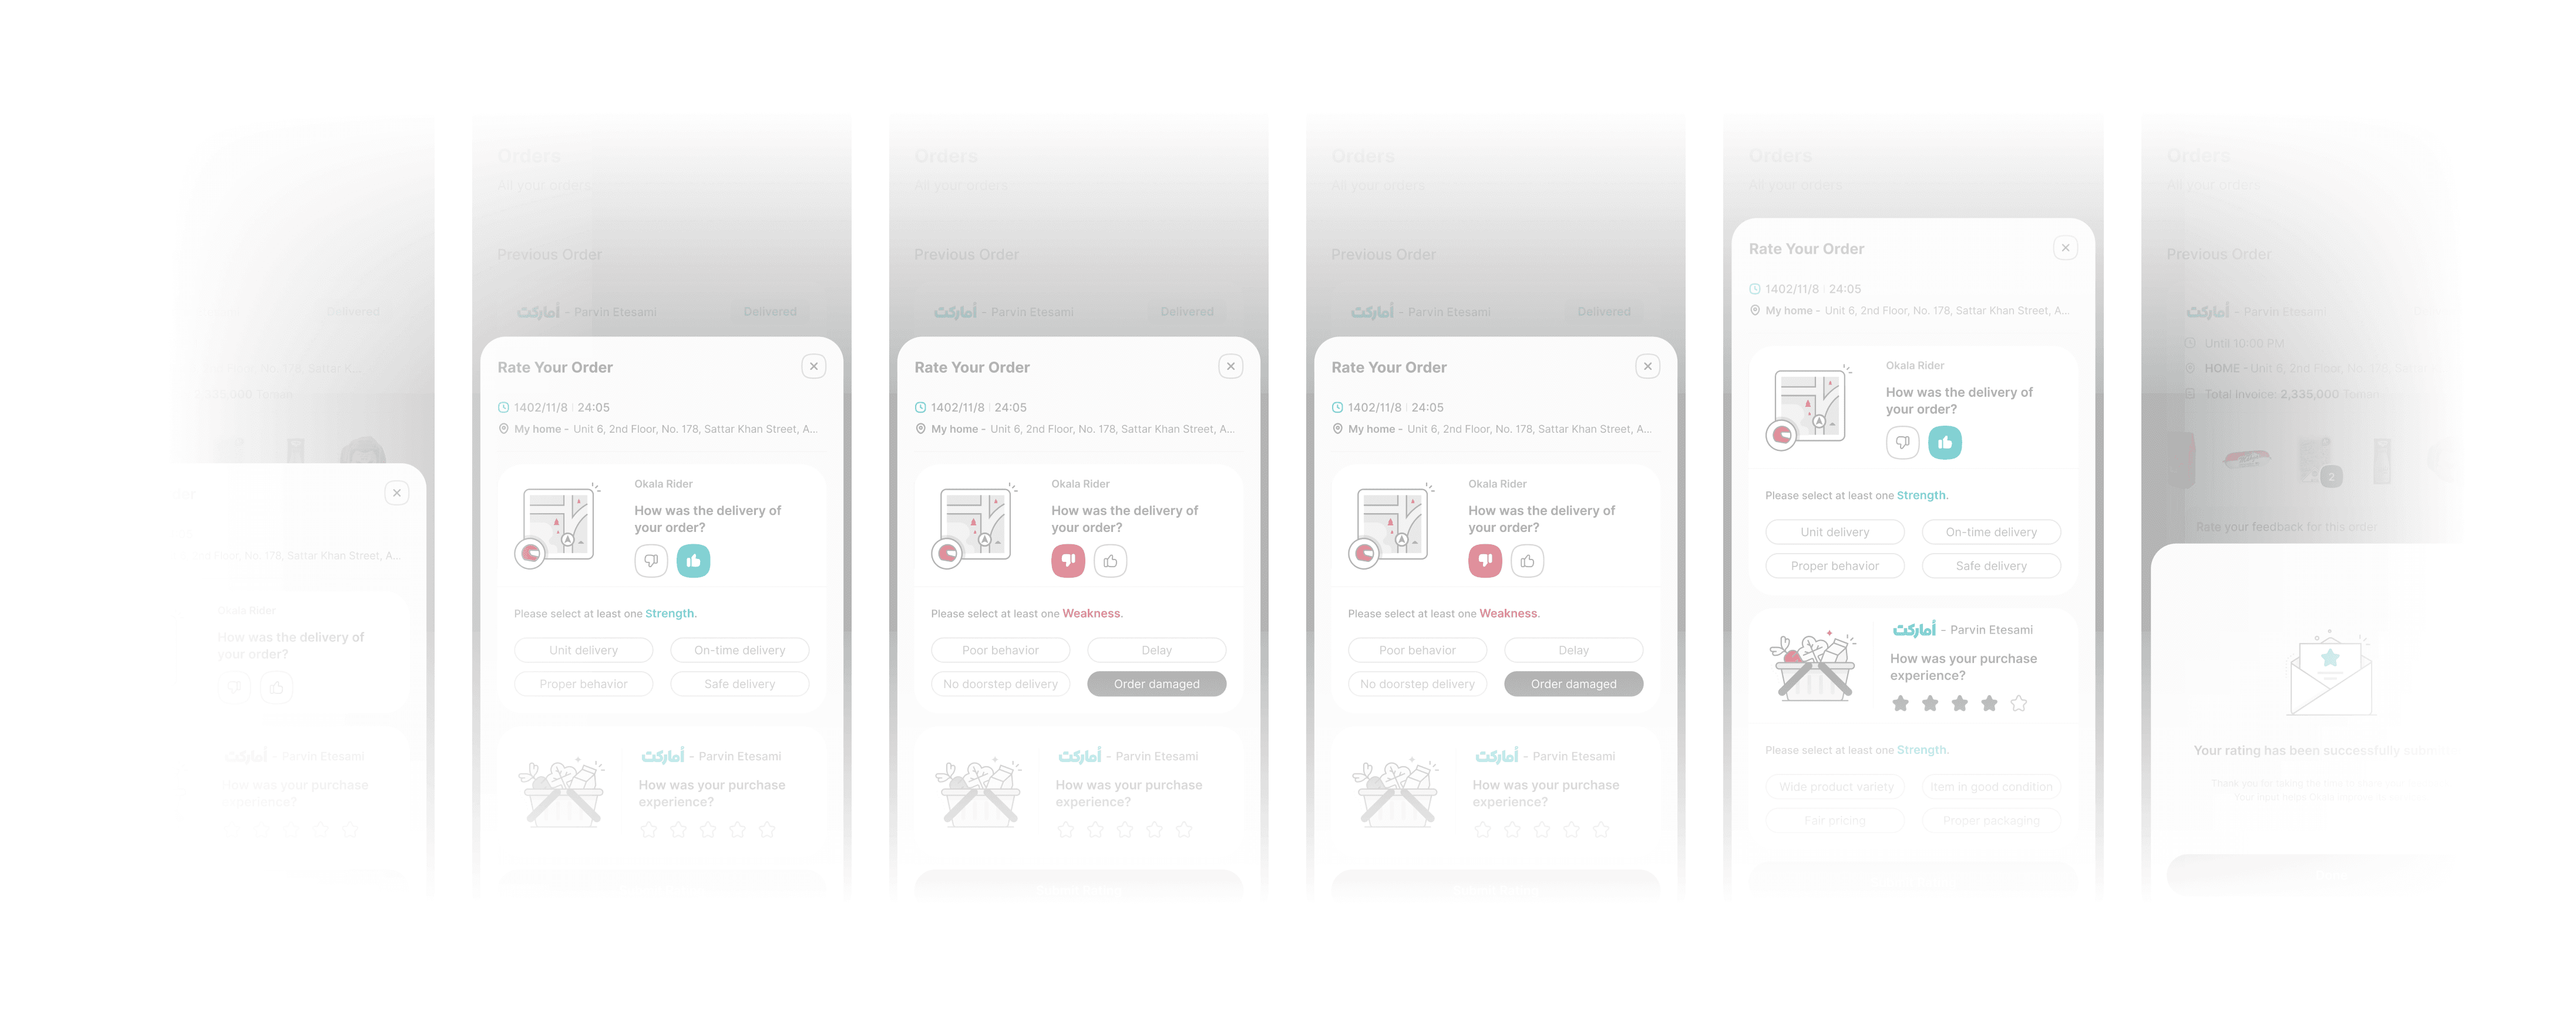
We designed three pathways for users to access the rating system. The primary path involved encouraging users to leave a rating after their order was delivered, either through SMS or push notifications, or when they returned to the app for the first time after the order. If the user closed the pop-up and wasn’t ready to rate at that moment, they had up to 3 hours post-delivery to provide a rating via the new and useful “Order Status” card at the top of the home page, which was added during the product redesign. If this window was missed, the only remaining option was through the order history, where users could rate the courier or store within 48 hours. Ratings were saved and recorded for each completed order.
The flow changes, based on key updates, aimed to streamline the process by consolidating everything into a single page. Users could now rate both the courier and the store or just one of them, selecting strengths and weaknesses as part of the rating process. To submit the rating, users were required to choose at least one option.
These updates greatly enhanced the collection of user feedback and data. Since the entire process took place within a bottom sheet, task completion rates improved significantly. At the same time, the time spent on the task was noticeably reduced, which in turn decreased the likelihood of drop-offs.
Retest and Measurement
After implementing the changes and optimizing the design, we conducted a usability test using a prototype. Fortunately, we found that the designed flow was highly functional for users. Based on the usability test, we significantly reduced Time on Task (TOT) and successfully lowered the drop-off rate. Additionally, 9 out of 10 participants were able to complete the task based on the given scenario.
One of our concerns was whether users would understand that they could rate only one category if they preferred. The usability test confirmed that this was clear and practical for users, with 4 participants correctly utilizing this feature.
َUser flow

After finalizing the design file, we handed it off to the development team. Once fully developed, we launched it for 100% of users to analyze user behavior and track key metrics. Our strategy involved closely monitoring all data and user interactions over a 20-day period to evaluate the effectiveness and functionality of the new rating system from every angle.
Fortunately, our analysis over these 20 days revealed a significant improvement. Contrary to previous data, a higher percentage of users expressed satisfaction with both couriers and stores. Additionally, a notable number of users actively participated in the rating system, validating its effectiveness.
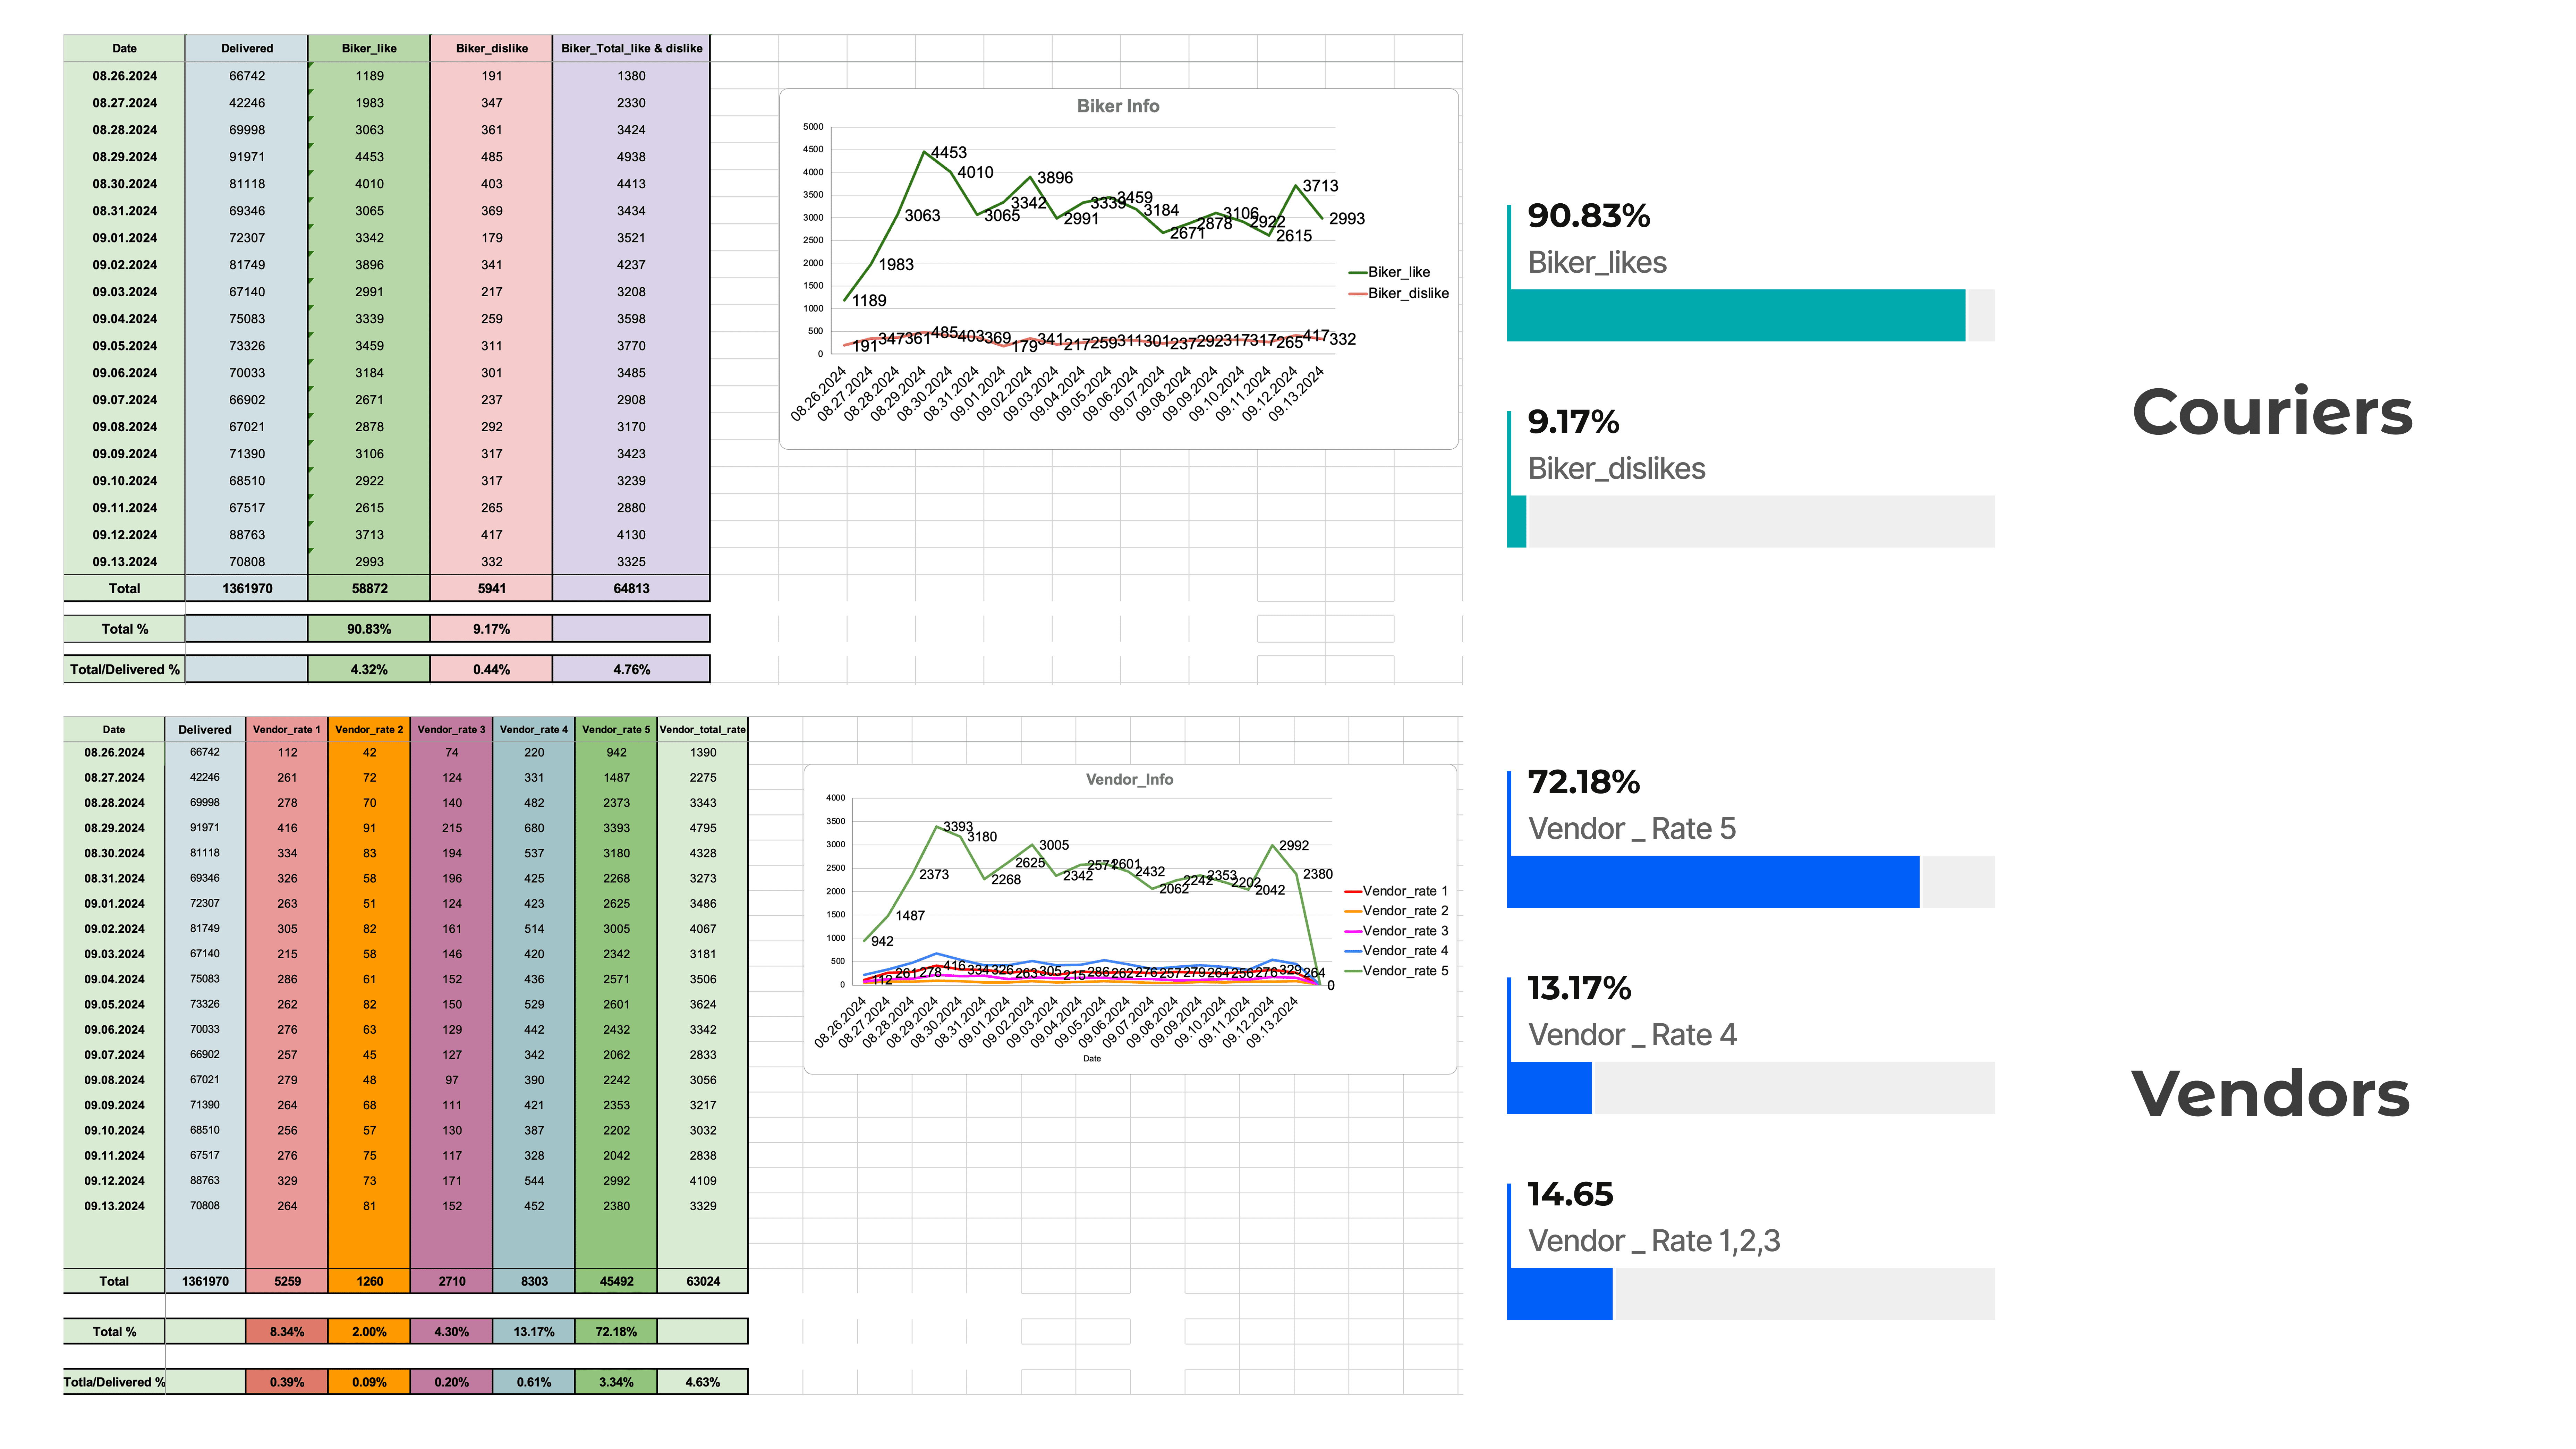
Courier Satisfaction Rate
90%
Vendor Satisfaction Rate
72%
CSAT
85.46%
NPS
+57.56
After collecting data and feedback through the newly designed rating system, the CX team was able to implement a set of policies for both bikers and vendors. These policies helped improve processes, increase customer satisfaction, and enhance user loyalty to the product.
• Customer satisfaction improved by ~18%, reflecting a better overall user experience.
• Biker performance in customer interactions and delivery efficiency enhanced by ~29%, leading to more reliable service.
• Store performance improved by ~15%, ensuring greater accuracy in order fulfillment and better packaging quality.
In the next phase of improving the rating system, we plan to introduce two new features:
1. User Comments: Users will be able to write feedback, especially when they encounter issues with a biker or vendor. This will help capture more context around problems, refine our data, and improve overall service quality.
2. Vendor Responses & Reviews: Vendors will have the ability to respond to user feedback, providing explanations for incidents and fostering better customer interactions. Additionally, users will be able to view detailed reviews about a vendor, helping them make more informed purchasing decisions.

Through this experience, I learned the importance of data-driven design and aligning solutions with user needs to effectively identify and resolve pain points. By simplifying the rating system’s flow, we not only improved the user experience but also enabled better data collection for stakeholder teams. This allowed the CX and operational teams to gain valuable insights and implement targeted improvements. Ultimately, this process reinforced how a clear and intuitive user journey plays a crucial role in enhancing overall satisfaction and engagement.
Other Case Studies
This case study shares the story behind the redesign of Okala — one of Iran’s leading FMCG platforms with over one million daily active users.
How a Living Design System Helped Saba Tamin Build Financial Products Faster and Smarter
This case study explores how we built a living design system for Saba Tamin, enabling their teams to deliver consistent, scalable, and faster financial products across both B2B and B2C platforms.